Even something as simple as changing my usual normal view of the SL experience to wireframe helps me find lost prims or invisible objects.
 |
| From IML Second Li... |
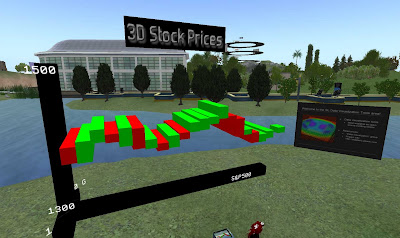
3D visualization of the Stock Market...
 |
| From IML Second Li... |
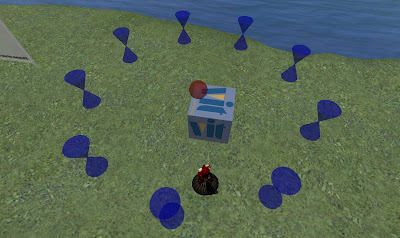
The Mind Map lets you navigate Subjects in Layers and shows how they are connected.
 |
| From IML Second Li... |
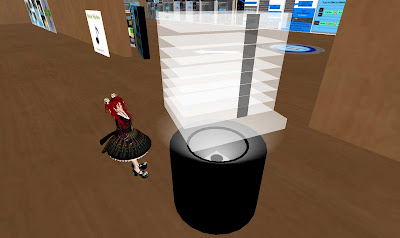
This doesn't pull information from a Database, but is very handing in looking at how an entire building is organized. Each of the areas can be clicked to pull up more information about each floor.
 |
| From IML Second Li... |
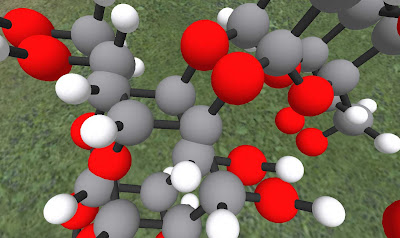
Molecule Rezzer. They gave me a free Caffeine model. bzzzzzzrp
 |
| From IML Second Li... |
ChatBots. Data with a human face. This was also on the Data Visualization Island. It is connected to a database that controls and avatars responses. Second Life has been called "avatarcentric"... does this change that statement now that it cannot be assumed any longer that avatars are controlled by a person?
 |
| From IML Second Li... |
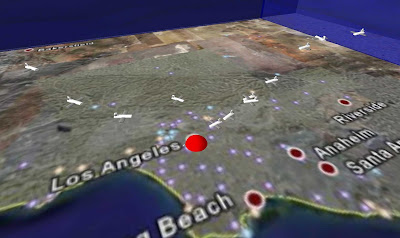
Airplane Traffic in real time.
 |
| From IML Second Li... |
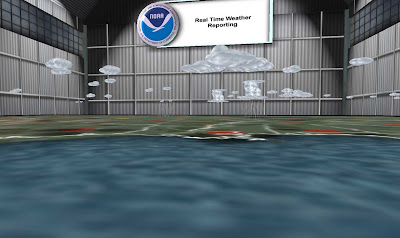
Weather in RT.
 |
| From IML Second Li... |
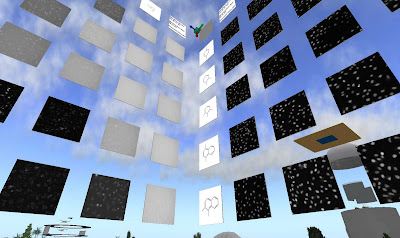
RESULTS!!! on x,y,z axis.....
 |
| From IML Second Li... |
The above examples can be seen HERE.
One of the projects that has recently been started by the IML is an open source educators tools. The visualization below shows how another piece of open source software has been contributed to over time. It's quite stunning.
code_swarm - Eclipse (short ver.) from Michael Ogawa on Vimeo.
No comments:
Post a Comment